
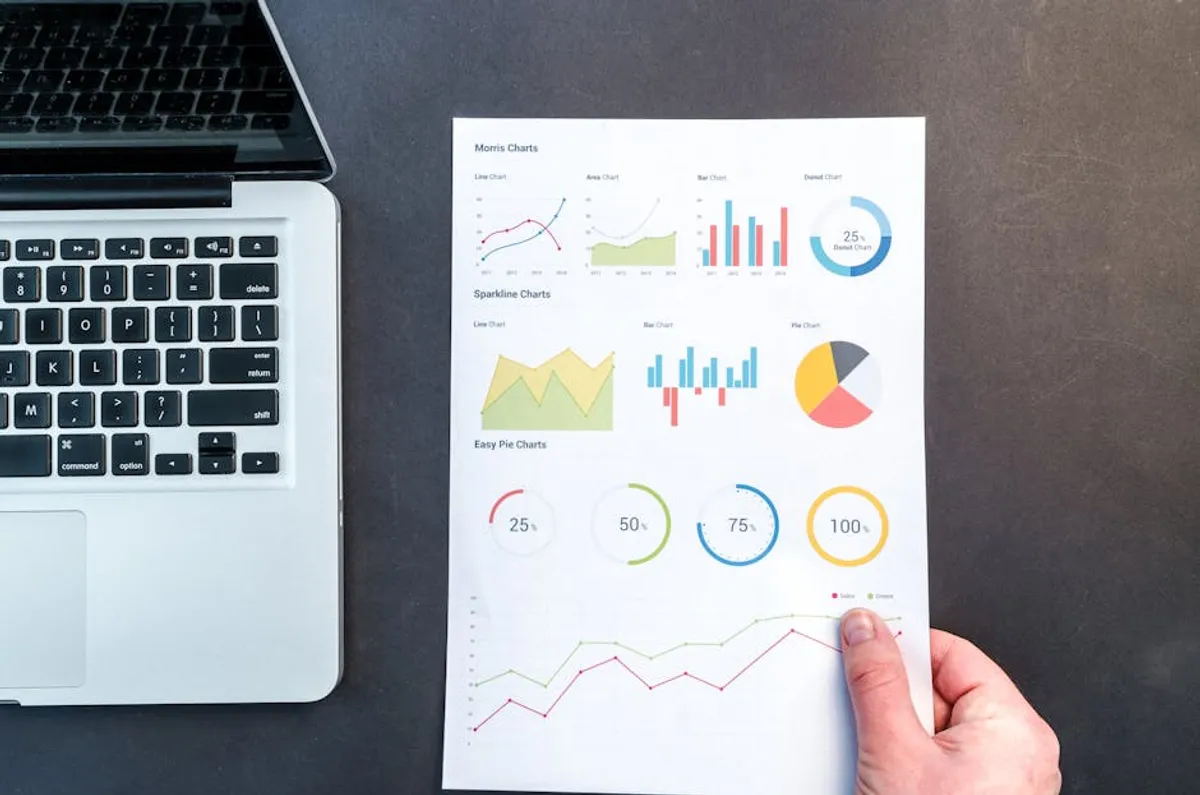
For marketers and content strategists, distilling the value and impact of an event into a digestible format is crucial for post-event engagement and future planning. Traditional text-heavy recaps often struggle to capture attention or convey complex data points efficiently. Infographics offer a visually compelling alternative, transforming raw event statistics, speaker insights, and attendee feedback into shareable, high-impact content. This approach not only enhances comprehension but also extends the lifecycle of event content, driving traffic and reinforcing brand authority long after the event concludes.
The strategic use of infographics in event recaps leverages visual communication principles to achieve specific commercial goals: increased brand visibility, improved content shareability, and enhanced data retention. By presenting key information in a structured, graphic format, businesses can articulate their event's success and impact more effectively to stakeholders, potential attendees, and the broader industry.
Why Infographics Elevate Event Recaps
Infographics are more than just decorative additions; they are functional tools for content amplification and data interpretation. Their distinct advantages over plain text recaps are rooted in cognitive processing and digital distribution patterns.
- Visual Storytelling for Engagement: Humans process visuals significantly faster than text. An infographic uses design elements—icons, charts, color—to guide the viewer through a narrative, making complex event highlights immediately comprehensible and more engaging. This visual structure holds attention longer, directly impacting time-on-page metrics.
- Shareability and Backlink Potential: Visually appealing content is inherently more shareable across social media platforms. When an infographic encapsulates valuable, unique event data or insights, it becomes a prime candidate for organic shares and, critically for SEO, backlinks from other industry publications or blogs referencing the data.
- Data Simplification and Retention: Events generate significant data, from attendance figures to survey results. Infographics distill this information into easily digestible chunks, converting raw numbers into clear visual representations. This simplification aids in information retention, ensuring that key takeaways from the event resonate with the audience long after they've viewed the recap.
Key Data Points to Visualize
Selecting the right information to visualize is critical for an effective event recap infographic. Focus on data that tells a clear story and provides value to your target audience.
Best for: Demonstrating event scale and reach.
- Attendance and Demographics: Numbers of attendees, geographical distribution, industry breakdown, and job titles. Visualizing these figures provides a clear picture of the event's reach and audience quality.
- Keynote Speaker Highlights: Condense salient quotes, statistics, or actionable advice from prominent speakers. This offers quick value and reinforces the intellectual capital of your event.
- Engagement Metrics: Showcase social media mentions, hashtag usage, live poll results, or Q&A participation. These metrics prove audience interaction and the dynamic nature of the event.
- Sponsor Visibility and ROI: If applicable, visualize sponsor mentions, booth traffic, or lead generation data. This offers tangible proof of value for partners.
- Future Event Teasers: Include a call to action or a sneak peek at upcoming dates/themes. This maintains momentum and encourages early interest.
Designing Effective Event Recap Infographics
Effective design ensures clarity and impact. Prioritize functionality over purely aesthetic flourishes.
Design principles: Clarity, brand alignment, and data accuracy.
Choose a format that best suits your data: a timeline for chronological events, a comparison chart for contrasting data points, or a statistical infographic for numerical summaries. Maintain brand consistency by incorporating your brand's color palette, fonts, and logo. This reinforces brand recognition and professionalism. Ensure all text is concise and data labels are clear, avoiding jargon. Every data point should be easily understandable without extensive additional explanation. Integrate a clear call to action (e.g., "Download the full report," "Register for next year's event") to guide viewer behavior.
Pro Tip: When designing, prioritize mobile responsiveness. A significant portion of your audience will view the infographic on smartphones. Ensure text is legible, and graphics scale appropriately on smaller screens to prevent a poor user experience, which can negatively impact engagement and shareability.
Distribution Strategies for Maximum Reach
Creating a compelling infographic is only half the effort; effective distribution ensures it reaches the intended audience and generates commercial value.
Distribution channels: Multi-platform approach for wider visibility.
Embed the infographic directly into your event recap blog post or a dedicated landing page. This provides context and drives traffic to your owned media. Schedule posts across relevant social media platforms (LinkedIn, X, Facebook, Instagram), tailoring captions to each platform's audience. Utilize email marketing by including a snippet or a direct link to the infographic in post-event communications to attendees, registrants, and subscribers. Reach out to speakers, sponsors, and partners with a ready-to-share link, encouraging them to distribute the infographic within their networks. This amplifies reach through trusted channels.
Measuring Infographic Performance
Tracking specific metrics helps evaluate the commercial impact of your infographic and informs future content strategy.
Key metrics: Quantifying engagement and SEO value.
Monitor website traffic to the page hosting the infographic and track the average time users spend on that page. High engagement suggests the content is valuable. Use social media analytics to track shares, likes, comments, and mentions. These indicate content resonance and organic spread. Employ backlink monitoring tools to identify new links pointing to your infographic or the associated content. Backlinks are a direct SEO benefit. If the infographic includes a call to action (e.g., a form fill, download), track conversion rates to assess its effectiveness in lead generation or specific commercial goals.
Optimizing Infographics for Search Engines
Infographics can contribute significantly to your SEO efforts when properly optimized.
SEO considerations: Technical and content-based optimizations.
Use descriptive, keyword-rich file names (e.g., "event-name-2023-recap-infographic.png") and comprehensive alt text that accurately describes the visual content and incorporates relevant keywords. This aids image search and accessibility. While direct schema markup for infographics isn't standard, consider using ImageObject schema if the image is the primary content of a page. Crucially, embed the infographic within a well-written blog post that provides additional context, analysis, and relevant keywords. Search engines prioritize content surrounded by authoritative text.
Actionable Steps for Your Next Event Recap
To integrate infographics effectively into your next event recap, begin by identifying the core narrative or key data points you want to convey. Sketch out a basic wireframe of how these elements could be visually represented. Collaborate with a designer to transform your data into a compelling visual story, ensuring brand consistency and clarity. Finally, plan your distribution strategy in advance, identifying target platforms and outreach opportunities to maximize the infographic's commercial and SEO impact.
FAQ
Q: What tools are best for creating event recap infographics?
A: Tools like Canva, Piktochart, and Venngage offer user-friendly interfaces and templates suitable for creating professional-looking infographics without extensive design experience.
Q: How long should an event recap infographic be?
A: Aim for a length that covers key points without overwhelming the viewer. Vertically oriented infographics are common, but prioritize conciseness. If the data is extensive, consider breaking it into a series of smaller, related infographics.
Q: Can infographics improve my website's SEO?
A: Yes, indirectly. Well-designed, valuable infographics can earn backlinks, increase social shares, drive traffic, and improve time-on-page metrics, all of which signal quality and authority to search engines.
Q: Should I include all event data in one infographic?
A: No. Select the most impactful and compelling data points that tell a cohesive story. Overloading an infographic with too much information can make it difficult to read and reduce its effectiveness.